Debugging - An Adventurous Journey? or a Horrendous Headache?
The journey and headache all developers share

Working as a Software Engineer. Occasionally contributing to OSS.
Dogs, Software, Music, Series, Beaches would be my go-to's. Treks TBA
Follow my blog where I post about Tech, RoR, and much more !!
It's been a while since I wrote a blog post. When I came across this challenge, and then it struck! Why not kickstart it back again by sharing my experience with the thing that I do every day at my work as well as while working on any personal projects, right?
My debugging adventure
A short prelude
So, back in 2020, when I started working as a software engineer, I was assigned to a team that worked on multiple tech stacks.
Ruby on Rails, which powered the web application
.NET Framework and .NET Core, which powered the installable applications.
For the first few months, I worked on the Rails app, started understanding the basics of the framework, and also managed to address a couple of bugs and build a feature that shows the audit trail of all the CRUD operations performed on the specific object.
The audit log would be a toned-down version of the below image.
I also have to tell you that the way that the audit trail keeps track of the feature, is through model object callbacks, (i.e) depending on the object life cycle, Active Record(a Rails ORM, you can understand what an ORM does via my other post) triggers a method to be run once the operation is done or before the operation etc. You can read about Active Record model objects here.
This object that is being tracked through the audit trail can be managed from the web application UI, updated through APIs, and also by several other integrations.
The Debugging Adventure begins
So, as I was progressing through building the audit trail functionality, I noticed a peculiar thing:
The audit trail was capturing date-time field updates as two separate entries when just triggering a dummy update with the same value shown in the UI form, which was previously updated through a background integration. The audit trail was showing wrong entries for the field updated with the same value, which was not the expectation.
Step 1: Understand the updation from the UI
So, with my curiousness peaking, I turned on the debugger in me and also added debugger keywords wherever needed in the code that I needed clarity on.
This is an example of how the date-time field looks in the UI form.
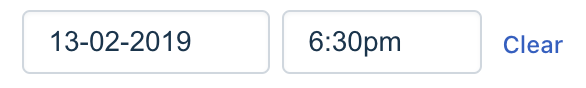
Just to ensure that I have the same time set already in the DB, I manually added the same date-time value in the database to mimic the scenario that the integration had already added the date, before triggering the dummy update from the Web UI.
The sample value I entered looked like this:- 2019-02-13 13:00:00 the same time as shown in the form, but it was in UTC.
I started going tracing the request from the form, checking the values of the date fields carried in the payload, and how they got processed by the server. And the value carried by the payload was something like this.
{ "expiry_date"=>"13-02-2019", "expiry_time"=>"6:30pm" }
And the server processed both the date and time values and converted them to a date-time value. I tried looking up for the UPDATE query which would have been fired to update the value. Since the column already had the same value, there was no query fired, and the audit trail also didn't track a duplicate entry. If the duplication wasn't happening now, how did it happen earlier? It made things clear, there should have been a difference in value, which triggered a change in the object lifecycle and thus the audit trail callback.
Step 2: Understand the updation from the integration
I started looking up logs for payloads from the integration, to find what value was being sent for the expiry property, and what was different. And it was in the UNIX Timestamp format
{ "expiry"=>"1550062857000" }
The timestamp is converted to date-time and saved in the table in UTC format, which again is 13th Feb, 2019, 6:30 PM. I set up the integration locally, added debuggers, traced the control flow and checked if the same date is being displayed and the UI also showed the same time. I triggered the dummy update again, and to my astonishment, the duplicate event was captured in the audit trail.
I knew I was missing something somewhere but was unable to narrow it down where.
Step N
I tried going through both flows, a couple more times, just to find which source was actually the culprit.

Took a walk, and had some coffee. I also went through the Active Record docs just to make sure my understanding of callbacks was right. Again looked at the code flow on how the processing was happening.
I started going through logs generated from both flows, and
Gotcha
The integration brings in the value as a timestamp, which is in milliseconds, and thus while converting to ISO8601, it saves the date-time along with the seconds. So, it's actually not 13th Feb, 2019, 6:30 PM, but it's 13th Feb, 2019, 6:30:57 PM. And the column value stored is as follows: 2019-02-13 13:00:57
So, when the Web UI brings in the date and time values separately, the time value doesn't have the seconds shown in Web UI. It is not present as a part of the payload as well, and thus even though the date and time values match with the table value, it lacks the seconds which the table value has. And thus the SQL Query is fired to update the time, which triggers the callback, allowing the creation of the duplicate audit trail entry.
Ah, that rush you get, when you find what's the root cause for the bug you have been debugging for.
Fix
So, in the UI, showing the second's value doesn't add much input to the end user, we took the call of parsing the timestamp by zeroing the second's value that we get from the integration before saving it in the table, and thus when the dummy update is triggered from UI, it doesn't fire a query -> no callbacks triggered -> no duplicate audit log entries.
#beginning_of_minute sets the time to the start of the minute, where the seconds value is zero
2.6.9 :221 > data = {}
 => {}
2.6.9 :222 > data['expiry'] = 1550062857000
 => 1550062857000
2.6.9 :223 > Time.zone.at((data["expiry"].to_i) / 1000)
 => Wed, 13 Feb 2019 18:30:57 IST +05:30
2.6.9 :224 > Time.zone.at((data["expiry"].to_i) / 1000).beginning_of_minute
 => Wed, 13 Feb 2019 18:30:00 IST +05:30
2.6.9 :227 >
The learnings
These learnings are not just from the above-mentioned adventure, but from multiple such experiences that I went through on a regular basis.
Be calm and patient
Explain the problem to yourself
Better understanding
Documentation to the rescue
Asking for help
Be calm and patient:
I cannot stress this one enough. We often wind up getting frustrated over that one extra SQL query that we are unable to find from where it's being fired or that one div element that doesn't seem to get aligned properly how much ever CSS we write.

Being frustrated just prolongs the time you might take to find the solution to your problem, and I will tell you how. In a hurry to arrive at the solution, your mind not have gone over all the things that would you would have usually gone through while debugging. Being calm helps you self-analyse if you have missed out on any specific thing and course-correct. Take a walk, talk to someone, drink a glass of water and then come back with better mental ammunition.
Explain the problem to yourself:
"Clarity precedes success" ~ Robin Sharma
Having clarity on what you're debugging sets you on the right track on where to start and course correct if you're moving in the wrong direction. And to attain that level of clarity, you can try explaining the problem to yourself.

This is often encouraged in a technique, named Rubber Duck Debugging , where the programmer is asked to explain the code to a rubber duck that they have in their possession. This helps you to arrive at the solution faster since now you would have a refined clarity of the issue.

Better Understanding:
By better understanding, we can further break it down into a few bullets.
The codebase/project you're working with.
The framework/libraries that you're using to write the code.
Using the right tool to write the code.
Understanding your codebase
Having a good grasp of the project codebase gives you a better edge in debugging issues faster. At the first, you might find it difficult to understand the codebase in its entirety especially if the codebase is huge. In such cases, this kind of learning happens gradually, and you get accustomed as you work more on the codebase. Tracing the logs that the code generates properly also helps you catapult your debugging journey.
Understanding the framework/libraries

Having adequate knowledge of how the framework operates or the libraries function helps you debug better. For instance, without getting a good grasp of how routing is implemented in the framework, you might end up losing time meddling with it. Obviously, with newer releases of the frameworks, you will have to keep yourself updated, but with enough knowledge, you can swim through the puddle of debugging, and squash those bugs like a river that runs through everything in its path.
Using the right tool
Nowadays, each language and framework has its own preferred IDE and editors, which come loaded with tons of features, with which you can ease your debugging journey. IDE's also have built-in debugging facilities that allow you to add breakpoints, break on specific exceptions and continue on other and much much more. Popular IDEs include Visual Studio for .NET, IntelliJ IDEA for Java, PyCharm for Python, RubyMine for Ruby etc.
Documentation to the rescue
Whenever you are stuck and feel that this can't proceed further, feel free to take a detour to the library or framework documentation that you're working with. Oftentimes, with the loads of information we take into our minds every day, it can be safely assumed that the library we once had a good grasp on, needs a refresher.

Websites like Devdocs, host documentation for a variety of languages and frameworks. And there is always official documentation put out, that can be sought out to deal the bug with.
Asking for help
There will come a point in your debugging journey, where you might not be able to find the root cause of the bug or find its solution. When you have tried out all sorts of things, and still it's bugging you, feel free to ask your co-workers or your mentor or anyone that you feel can help you out in arriving at the destination of your debugging journey.

Oftentimes, they might have also faced this earlier, and I might suggest a quicker way out, or even give you an insight or a pointer which might haven't struck you earlier.
Congrats

Ah, you survived. Kudos to you for that : )
Thanks for taking the time to go through my post. Feel free to leave any thoughts that might have crossed your mind as you read through. Felt like you could have utilized 9 mins of your time in a better way, go ahead, click on that comments button and add one. I would be more than happy to discuss them with you.
I shall come back with some more content. Until we meet again!